HOW SONY'SPLAYSTATIONBECOMES OURWEAPON
Sony generated $11.4B in a single quarter using a platform ecosystem strategy perfected over 30 years. This document extracts the core DNA of that strategy and translates it into Marvels-Play's path to $1B+ by 2030.
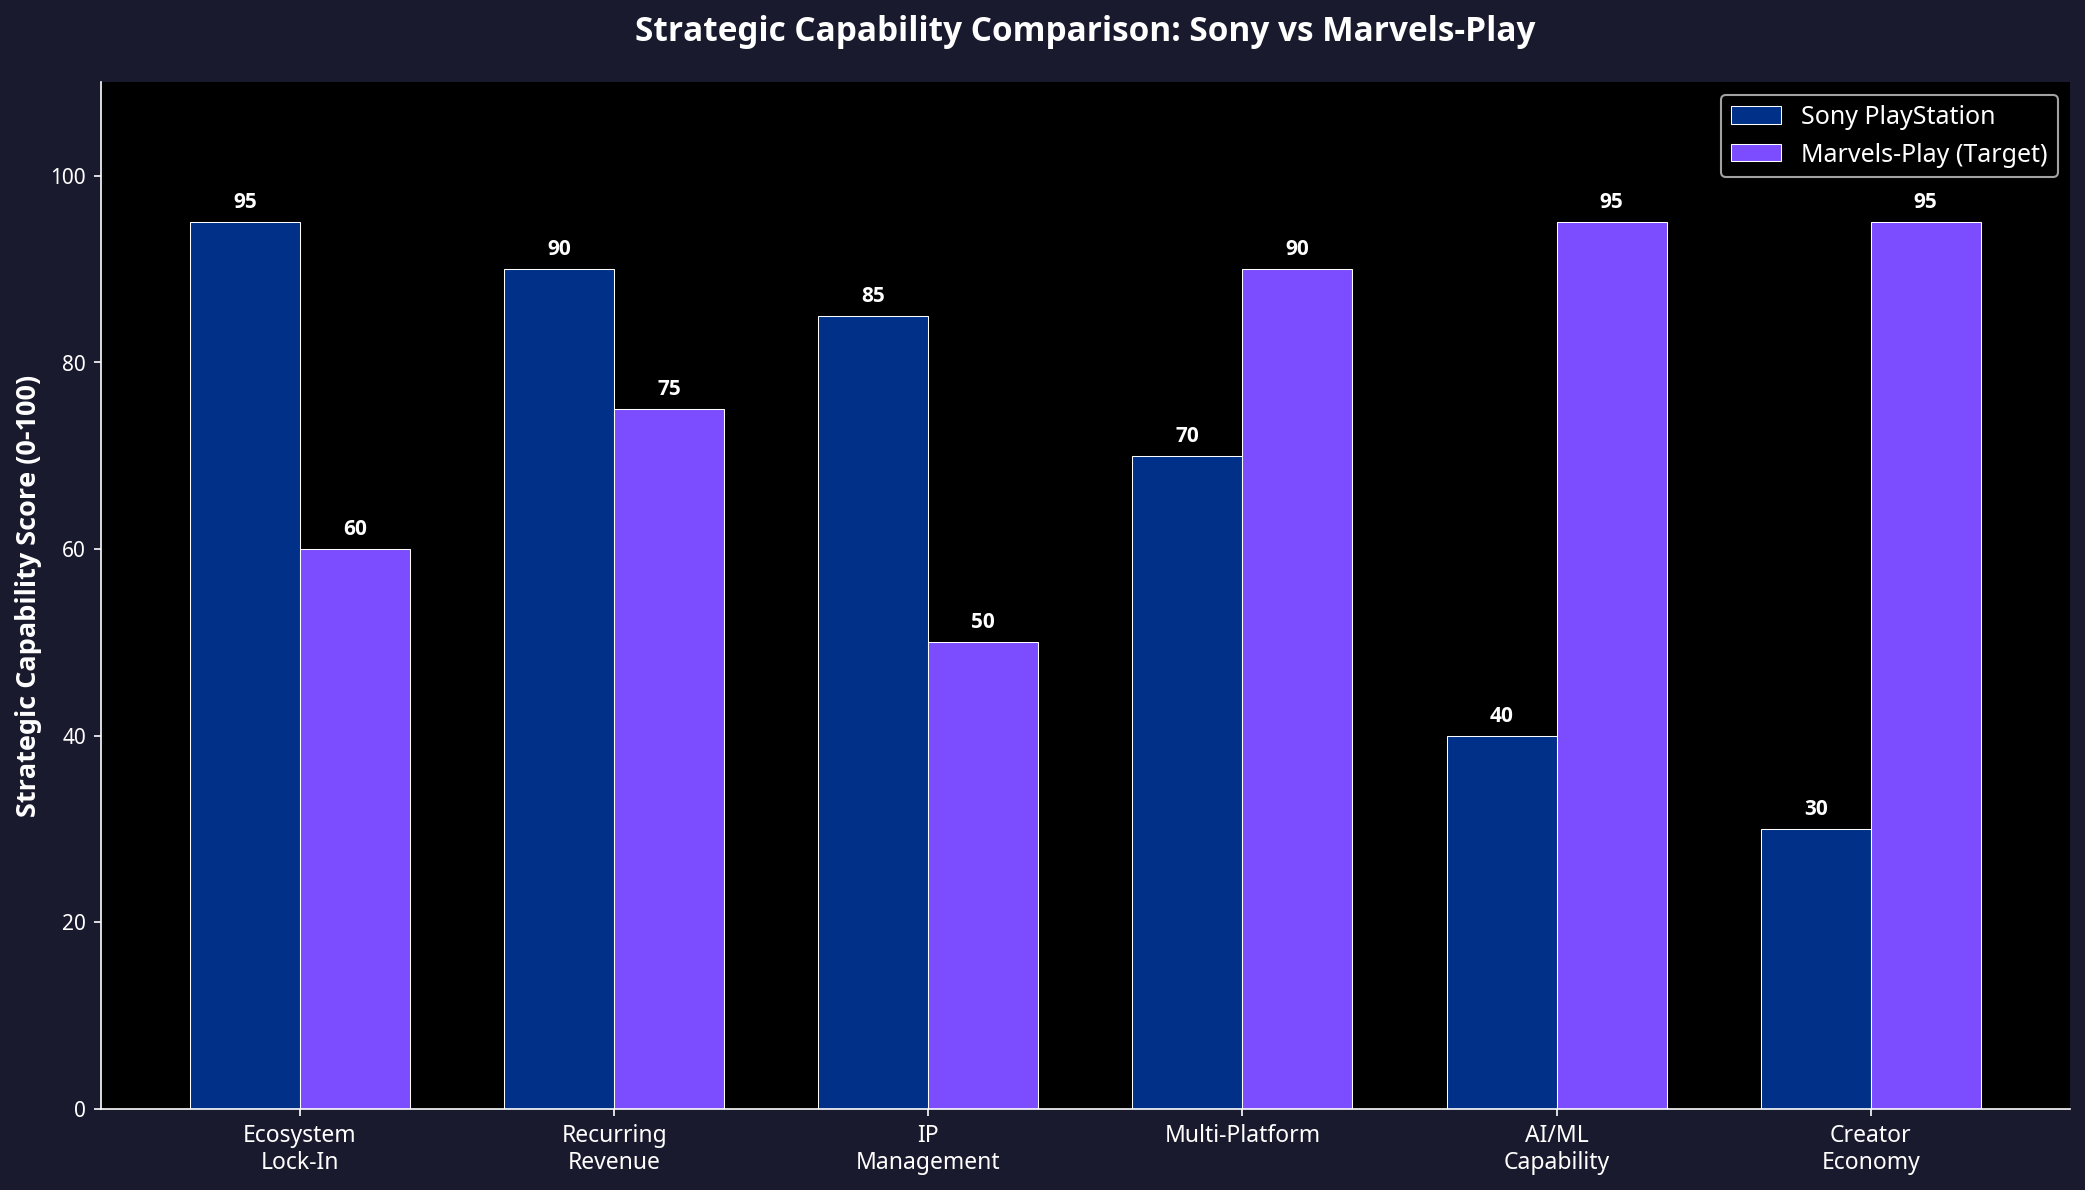
Sony PlayStation — The Benchmark We Are Translating
Sony Principle → Marvels-Play Equivalent
Every Sony competitive advantage has a direct Marvels-Play equivalent. The underlying strategic logic is remarkably transferable.
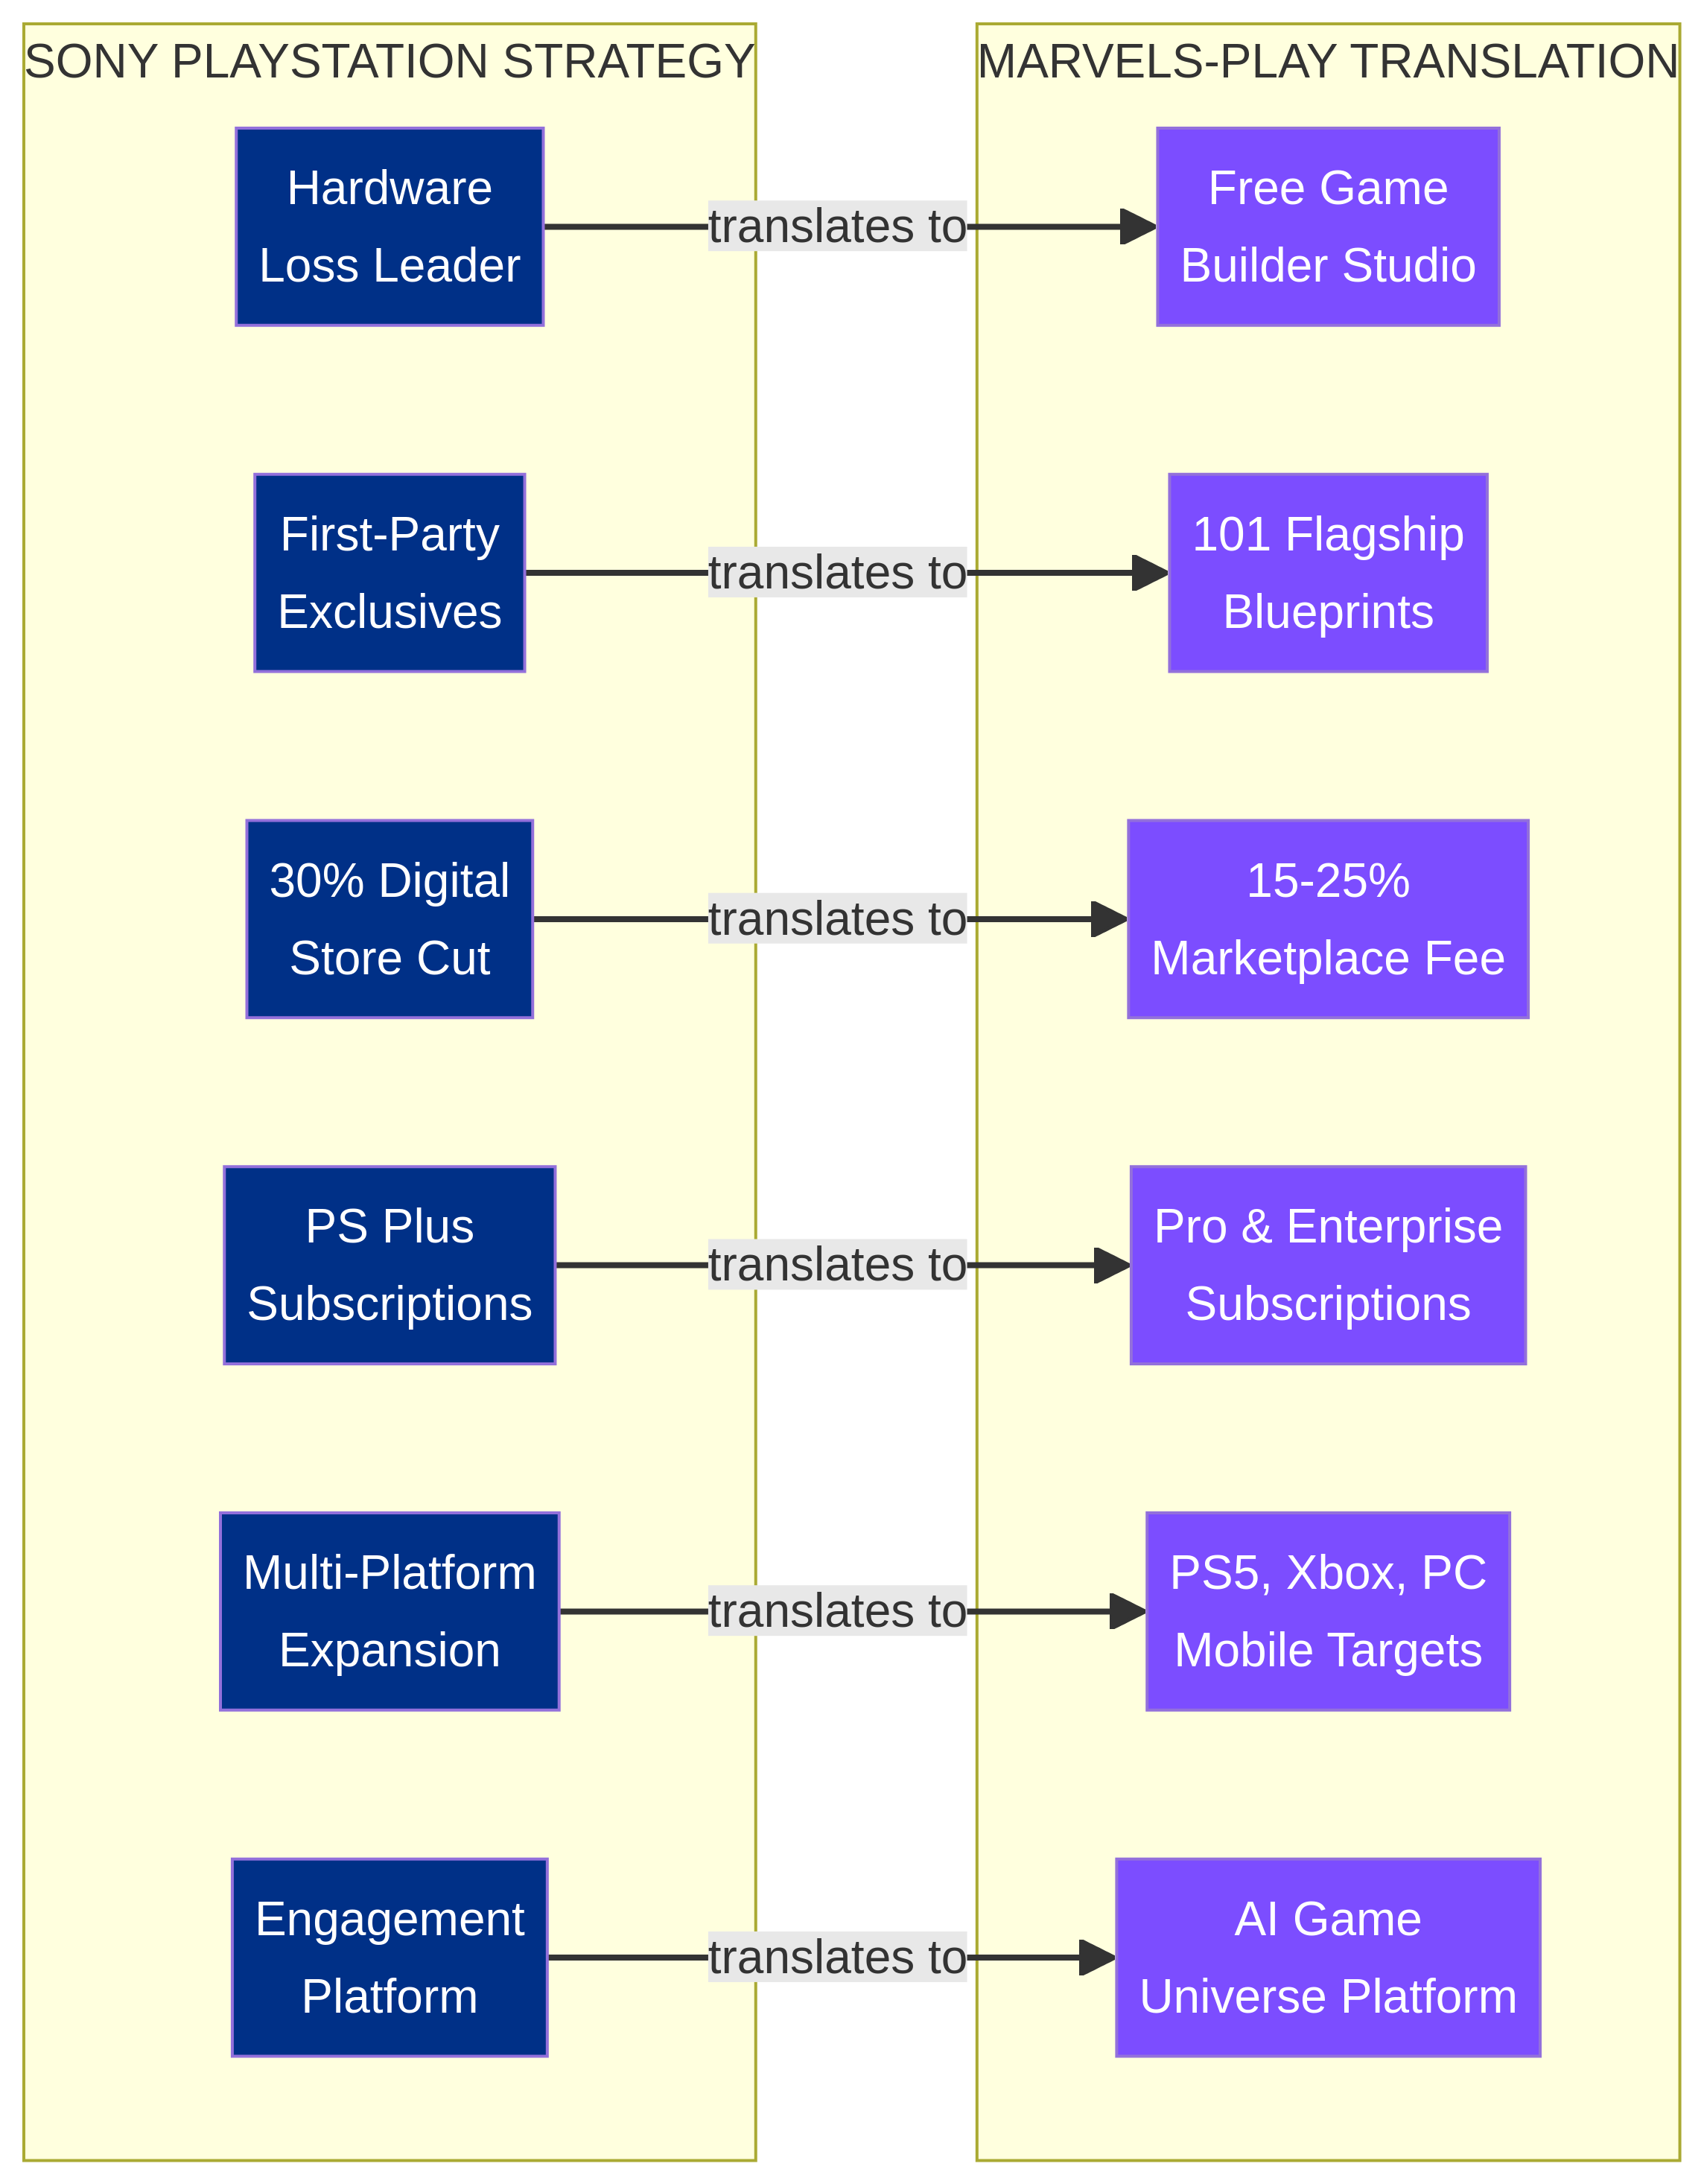
| Sony PlayStation Principle | Marvels-Play Equivalent |
|---|---|
| Hardware as loss-leader gateway | Free Game Builder Studio tier |
| First-party exclusive games | 101 flagship cinematic blueprints |
| Third-party royalties (30% cut) | Creator marketplace commission (15–25%) |
| PlayStation Plus subscriptions | Marvels-Play Pro / Enterprise tiers |
| PlayStation Studios portfolio | Internal blueprint creation teams |
| Multi-platform expansion (PC, mobile) | Multi-platform build targets (PS5, Xbox, Nintendo, PC, Mobile) |
| Engagement Platform (gaming + music + anime) | Game Universe Platform (blueprints + AI tools + community) |
| Strategic acquisitions | IP licensing partnerships |
| Transmedia IP expansion | Blueprint-to-game-to-universe pipeline |
| Long-horizon planning (2034 vision) | Five-Phase Master Plan (2026–2030) |
More Blueprints → More Players → More Revenue
Sony's flywheel: more users attract more developers, more developers create more games, more games attract more users. Marvels-Play engineers an identical flywheel.
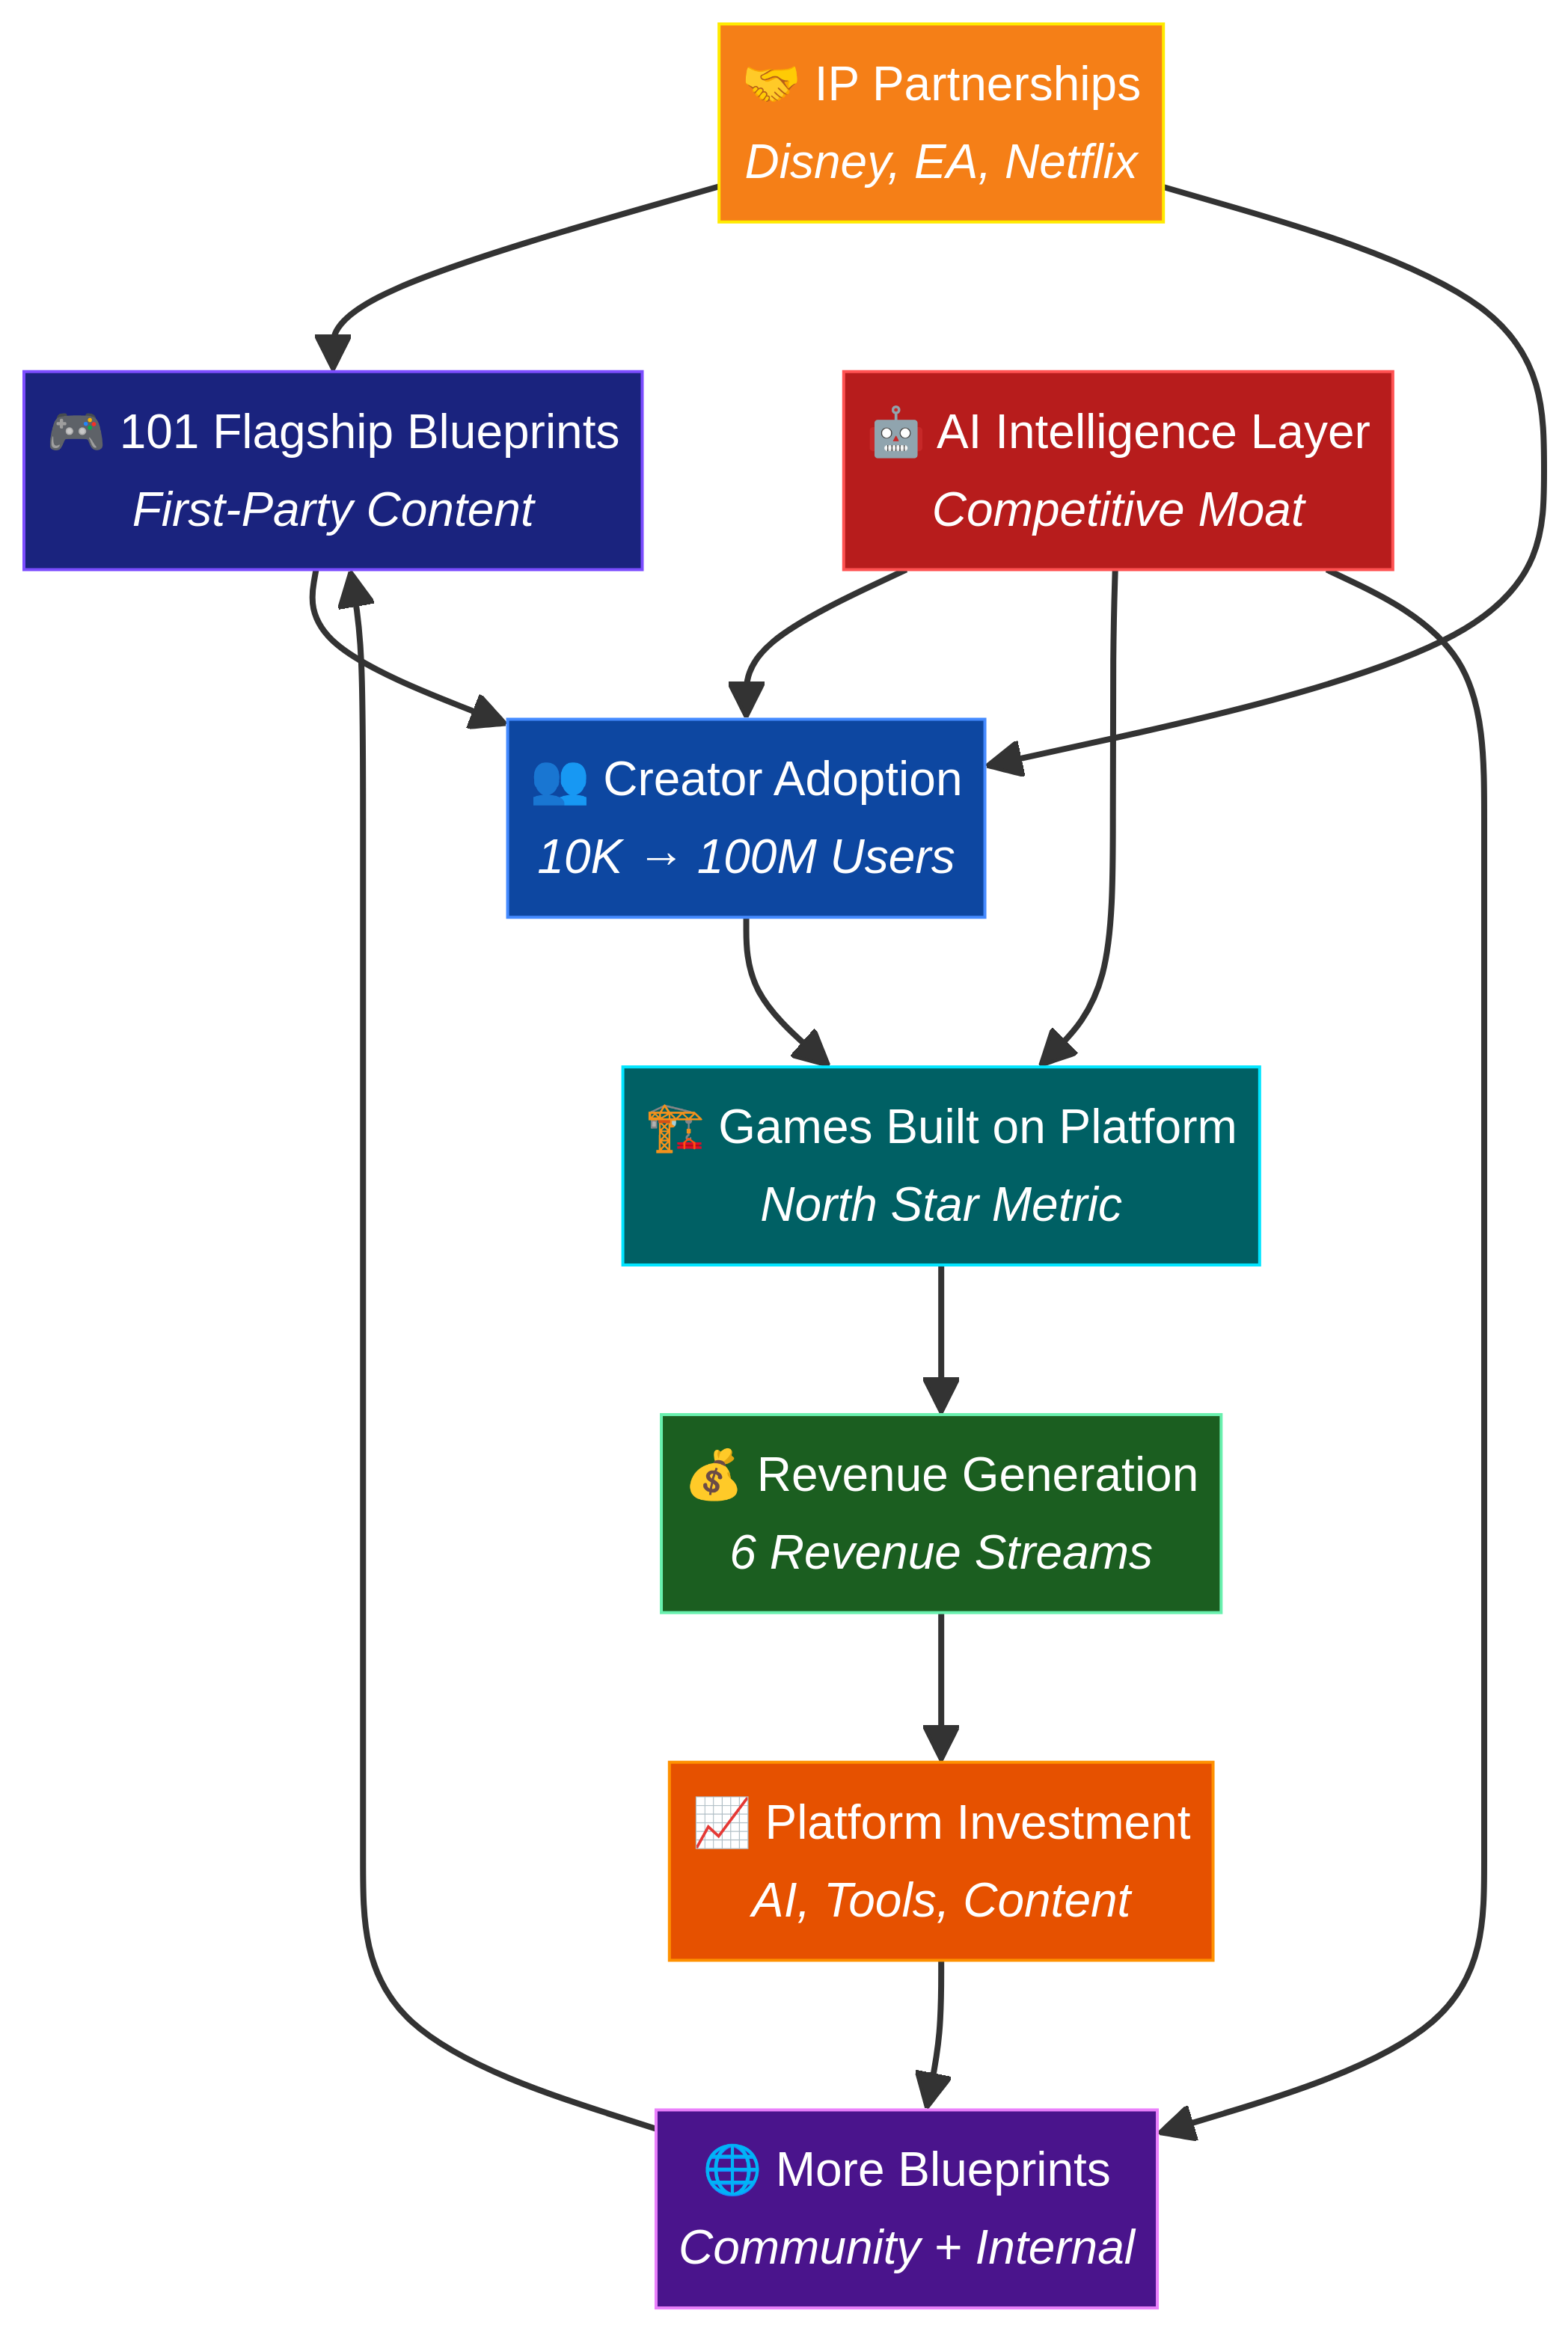
More Blueprints published on the marketplace
More Creators discover and use the platform
More Games built using Marvels-Play blueprints
More Revenue generated through sales and subscriptions
More Investment in new blueprints and AI features
Flywheel accelerates — network effects compound
2026 — 2030 Strategic Roadmap
Each phase mirrors a PlayStation generation. Each phase builds on the last. Each phase is a step toward the $1B+ valuation.
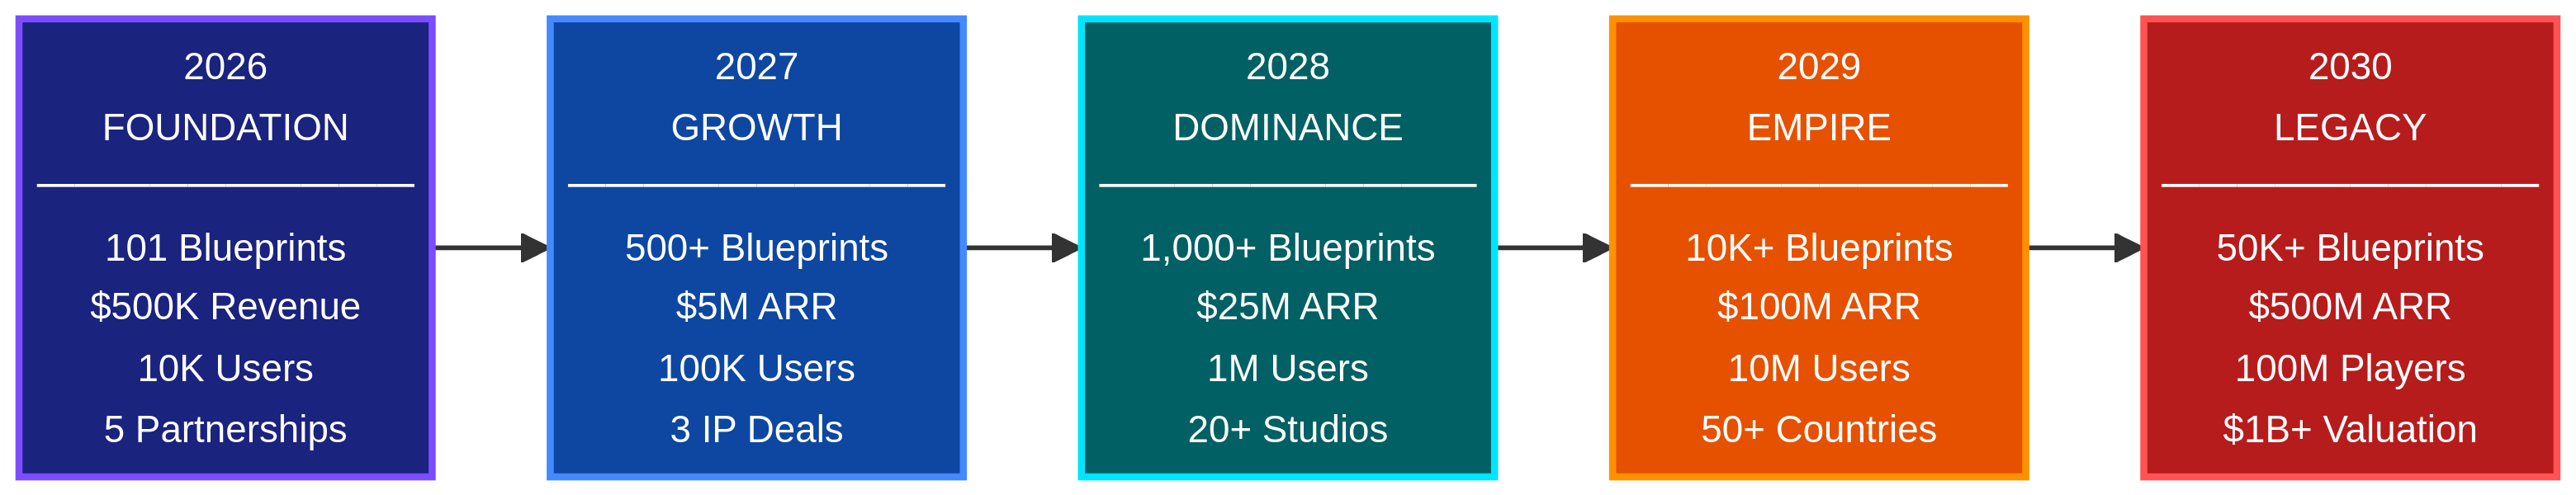
Launch the world's first game transformation marketplace. Establish product-market fit with 101 cinematic blueprints, AI GDD generator, and Stripe-powered commerce.
Six Revenue Streams
Mirroring Sony's six-layer revenue model. Each stream is designed to scale independently while reinforcing the others.
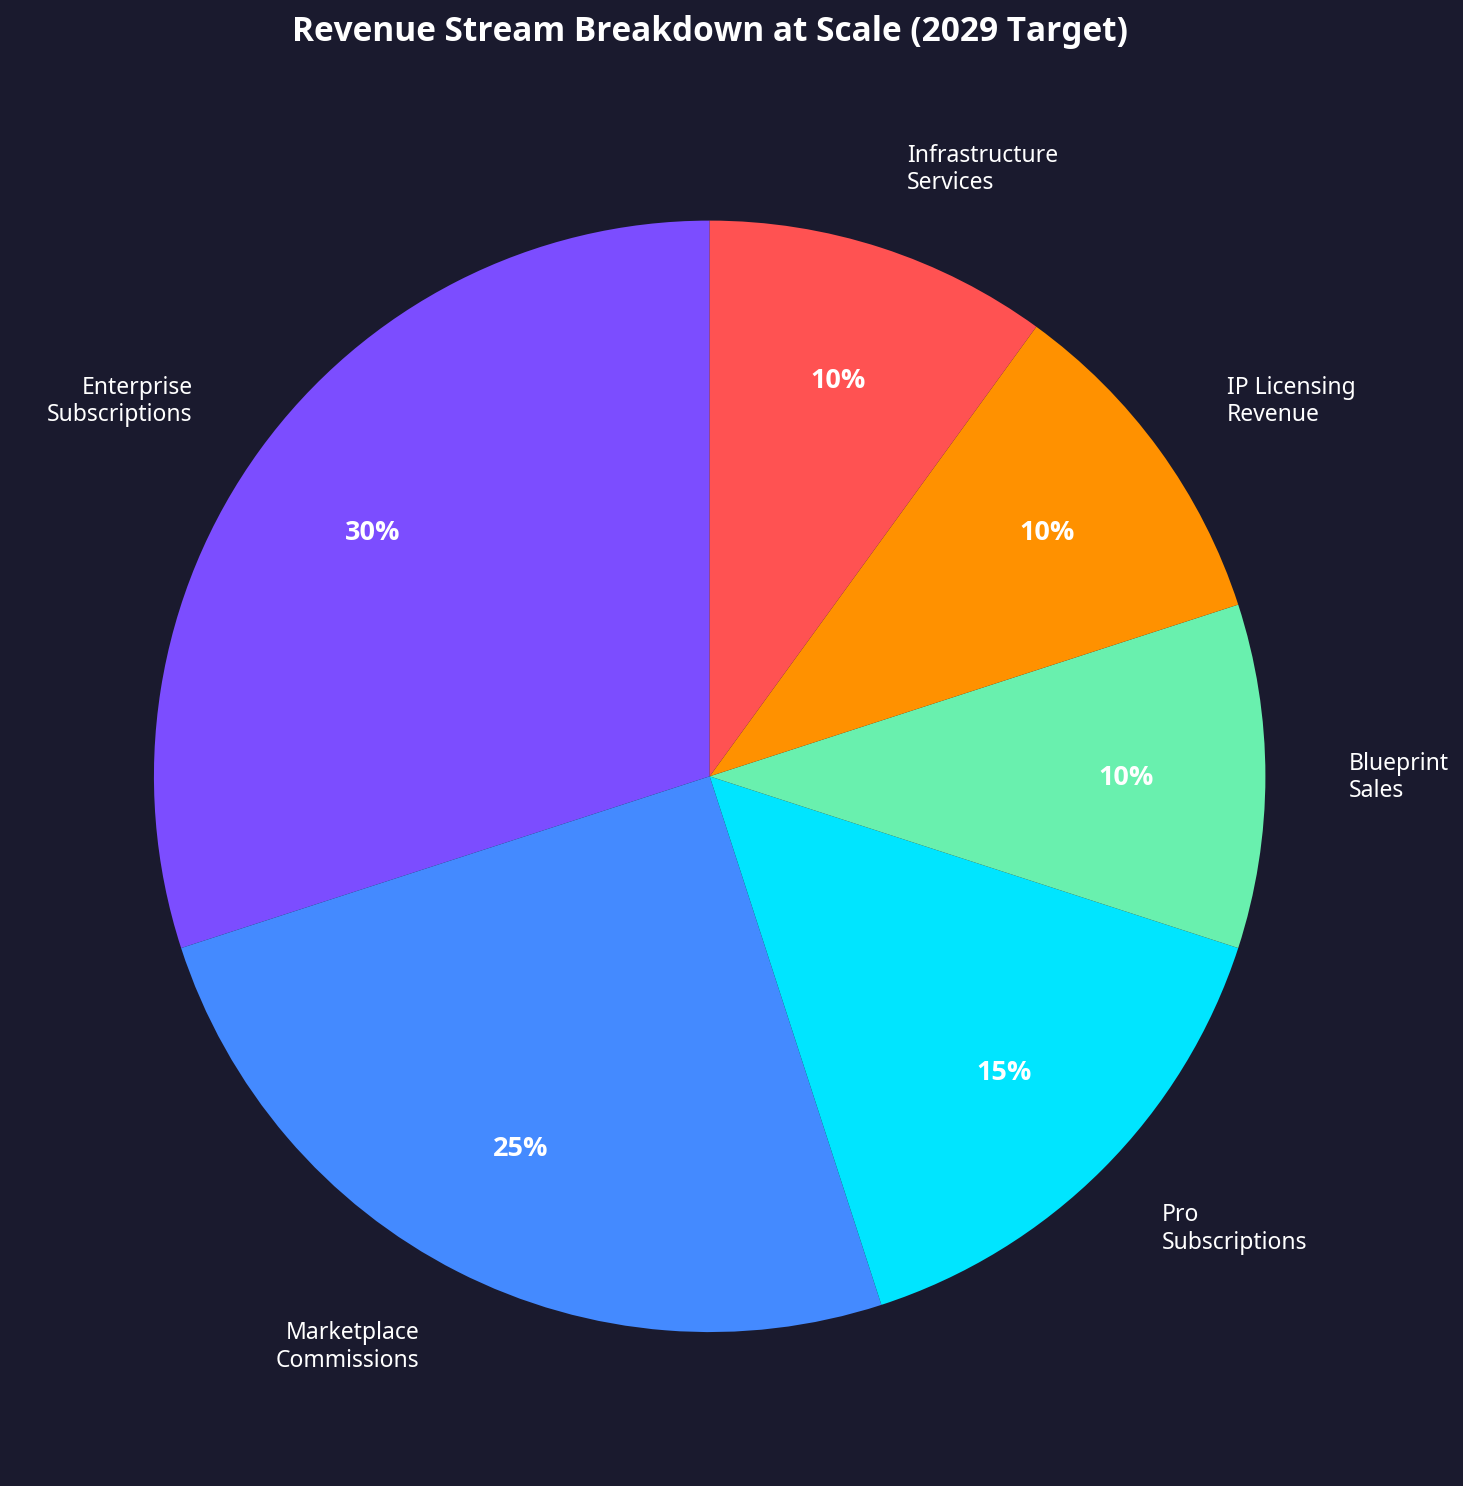
| Revenue Stream | 2026 (Phase 1) | 2028 (Phase 3) | 2030 (Phase 5) |
|---|---|---|---|
Direct Blueprint Sales | $150K | $2.5M | $50M |
Marketplace Commissions | $50K | $5M | $125M |
Pro Subscriptions ($29/mo) | $100K | $6.25M | $75M |
Enterprise Subscriptions | $50K | $7.5M | $150M |
IP Licensing Revenue Share | $50K | $2.5M | $50M |
Infrastructure Services | — | $1.25M | $50M |
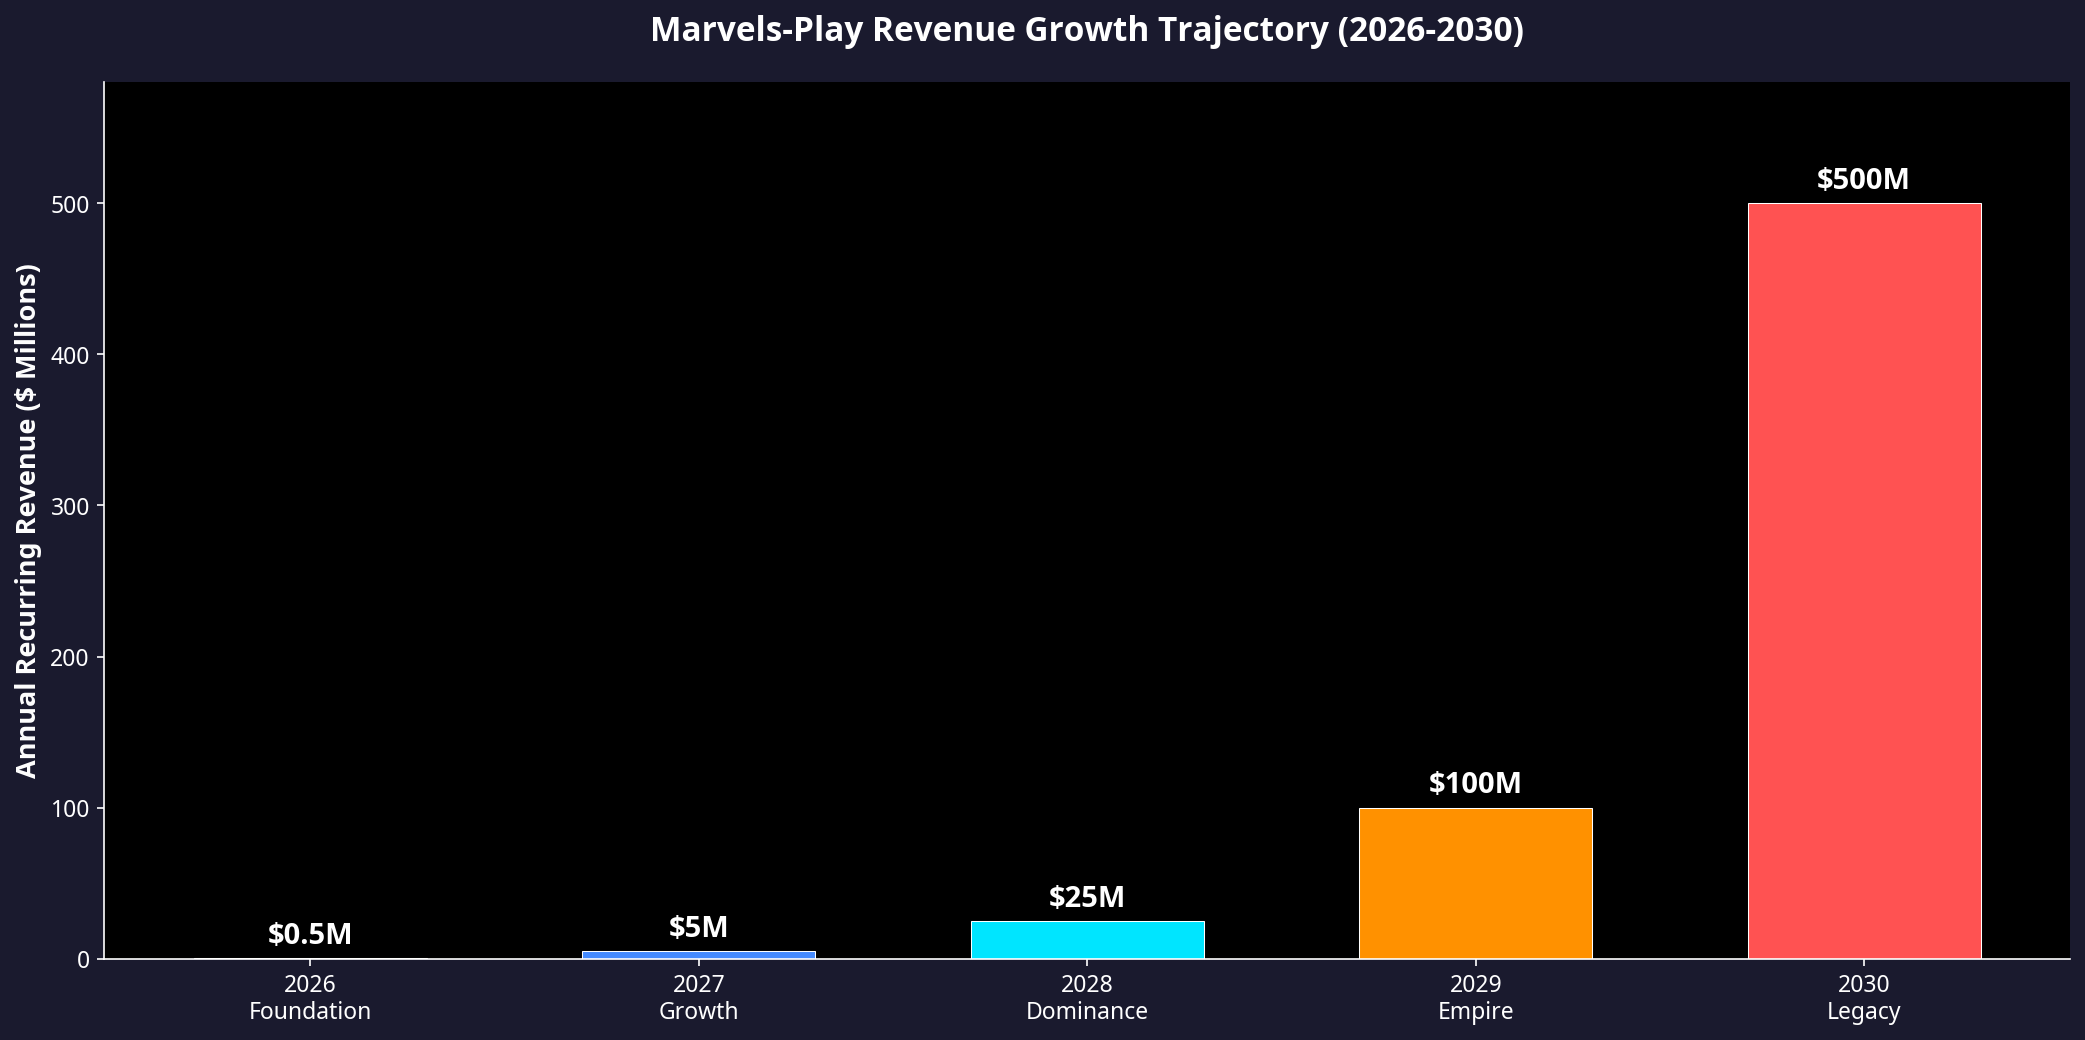
| TOTAL ARR | $500K | $25M | $500M |
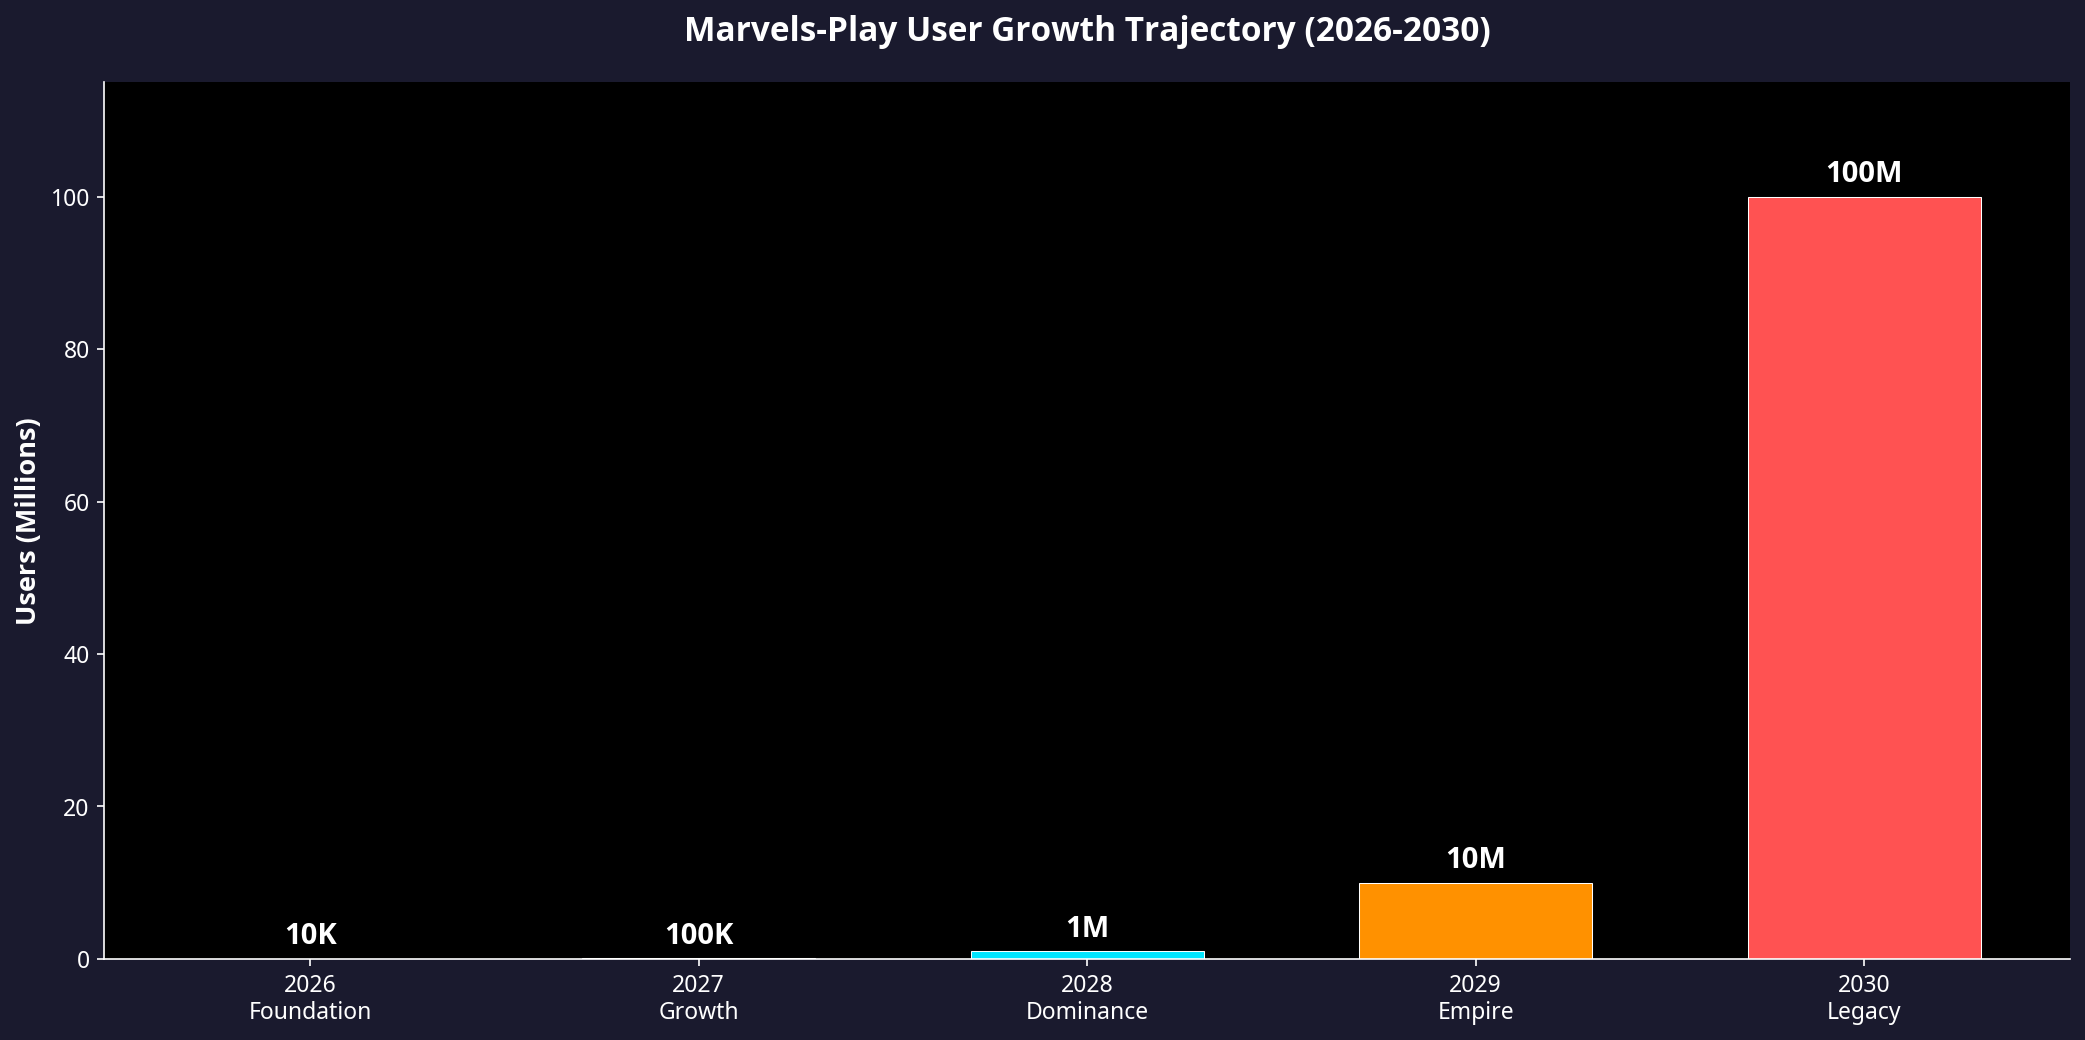
10K → 100M Players by 2030
10 Principles We Are Applying
Each principle has been battle-tested across five console generations and billions of dollars in investment. Each one is now being applied to Marvels-Play.
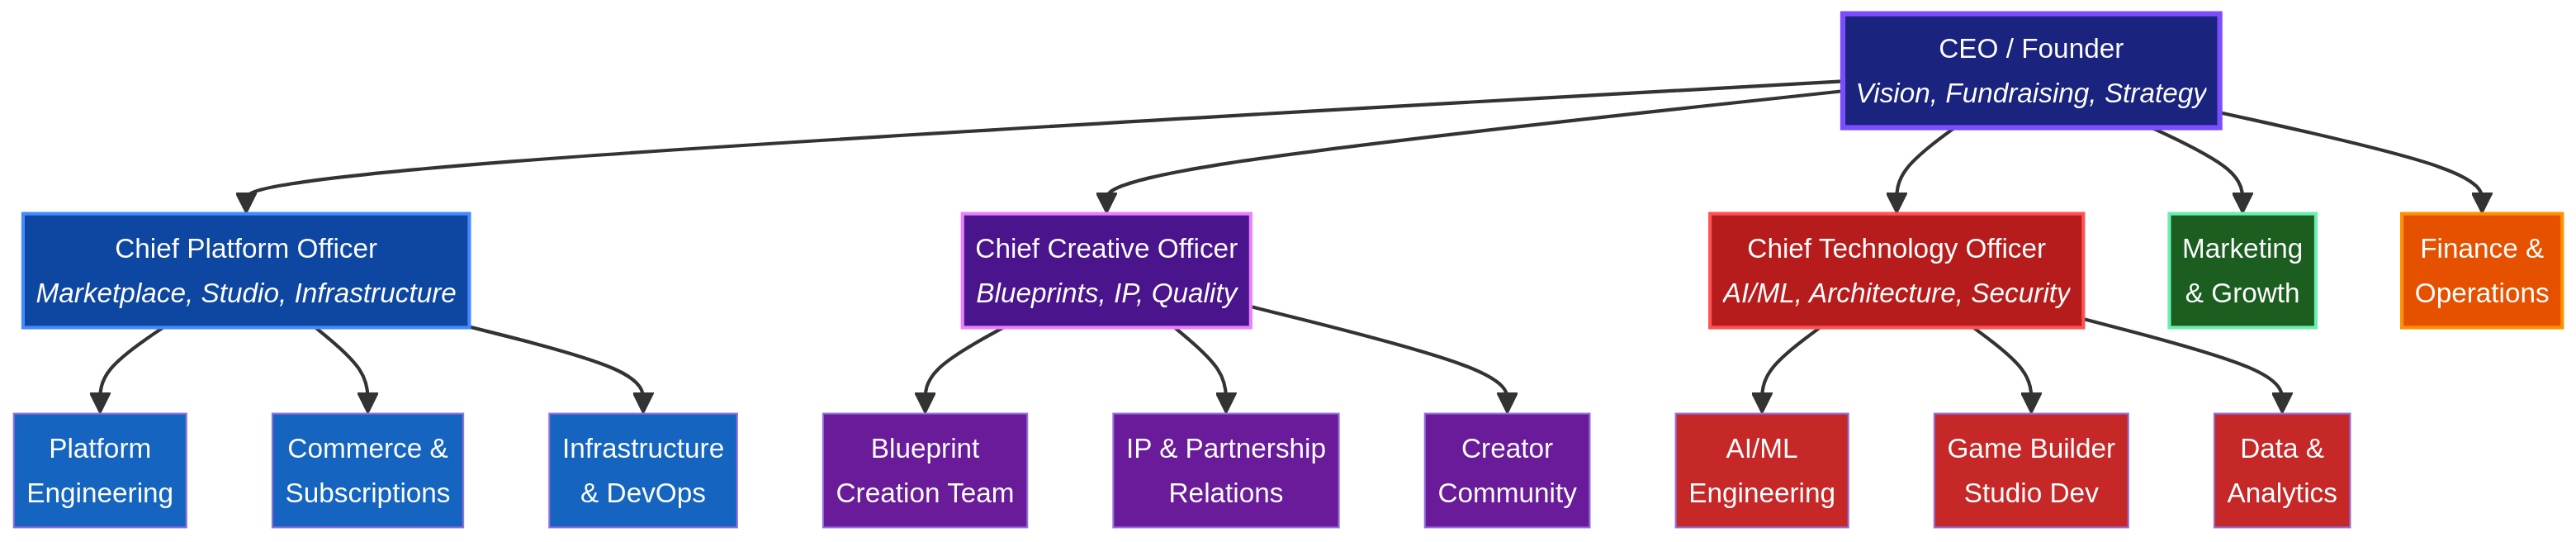
Sony Dual-CEO Model Applied
Sony's 2024 restructuring split leadership between Platform Business Group and Studio Business Group. Marvels-Play mirrors this with CPO + CCO + CTO.
| Phase | Team Size | Key Hires |
|---|---|---|
| 2026 — Foundation | 12–15 | CEO, CTO, Lead Designer, Developers, AI Engineer, Community Manager |
| 2027 — Growth | 30–50 | CPO, CCO, Sales team, Studio Relations, Content team expansion |
| 2028 — Dominance | 100–150 | Regional leads, Enterprise sales, Platform engineering, QA |
| 2029 — Empire | 300–500 | International offices, Localization team, Infrastructure engineering |
| 2030 — Legacy | 500–1,000 | Full organizational maturity with all departments |